Displays
Display(s)
The example files downloaded from this category will be automatically added in the atvise builder tree under the library “projects”. This library stays untouched when updating atvise resources (contrary to the library “atvise”). Feel free to adapt these atvise live examples as needed in regards to look and function.
Content:
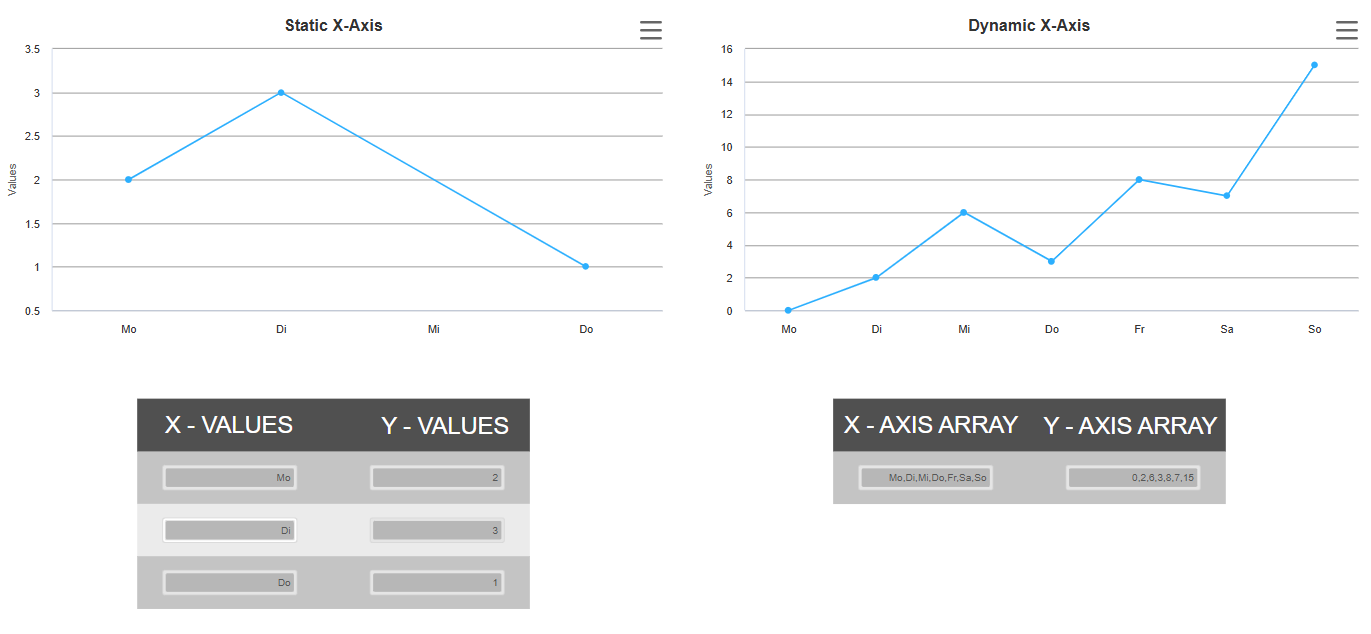
This atvise live component includes two xy-chart components, in which values of nodes are visualized with the highchart library.
The "static" trend implemented a x-series during the initialisation of the chart. Here in this example for every point there is a separate node chooseable for x and y. The value of the node will be used for the chart view and the by default set values will show you that there can be categories skipped.
The "dynamic" trend will use an array node for the x and one array for the y values. These can be configured in the atvise builder with the parameters provided by the component.
Hint:
Please make sure to login or enable "Set anonymous and NTLM users as Project administrators" to modify the y-data of the static trend.
Displays:
MAIN > ChartXY
Objects:
ChartDemo > dynamicXAxis
ChartDemo > weekdays
Library:
PROJECT > Object Displays > trends > popup > edit_dialog
PROJECT > Object Displays > trends > history_manager
atvise® version:
3.13
Content:
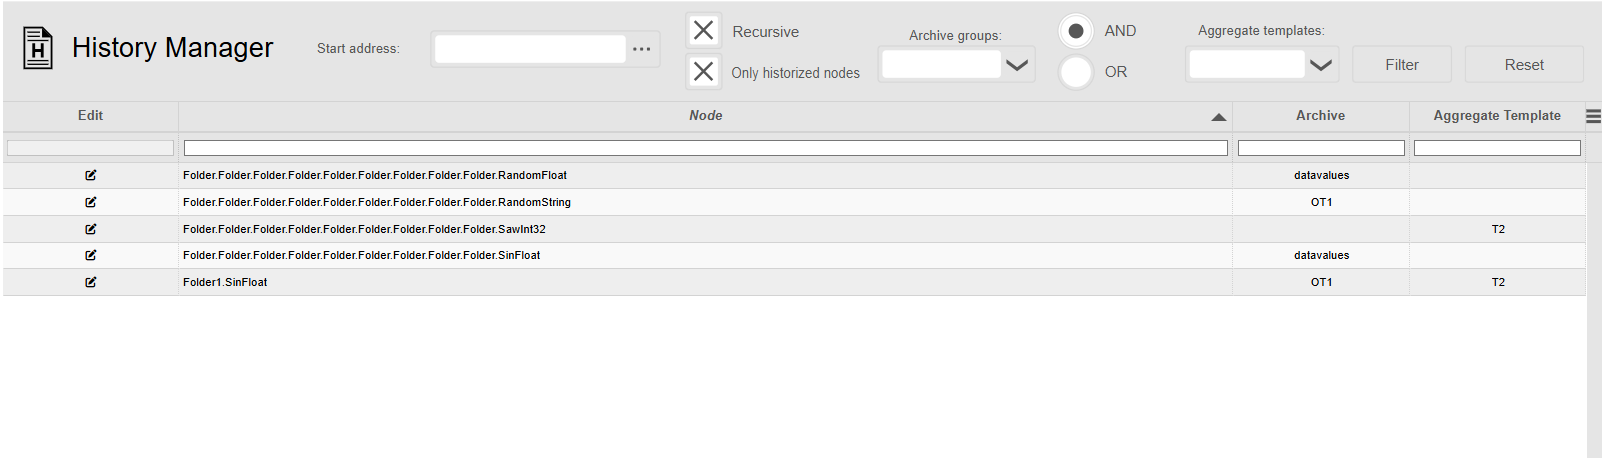
This atvise live component includes a history manager, where you can assign each node a historical archive and an aggregate template within the visualisation.
You can filter based on a start address using the address picker, the recursive checkbox and an archive and aggregate template name including an AND or OR condition. Using the "only historized nodes" checkbox you can get a list of all historized nodes.
If you would like to change or assign a historical archive or template you need to press the edit-symbol in the specific row, which will open a popup. In this popup you can assign the archive and aggregate template or remove
the existing assignment by selecting the empty option. After you confirm the changes, the table will reload automatically.
Hint:
Please ensure that the user configuring the historization has read rights for History section in the project tree and engineer rights for the desired node.
Displays:
MAIN > History Manager
Library:
PROJECT > Object Displays > historymanagement > popup > edit_dialog
PROJECT > Object Displays > historymanagement > history_manager
PROJECT > webMI Methode Scripts > GetArchivesAndAggregates
PROJECT > webMI Methode Scripts > GetHistorizedNodes
PROJECT > webMI Methode Scripts > UpdateHistorization
atvise® version:
3.13
Content:
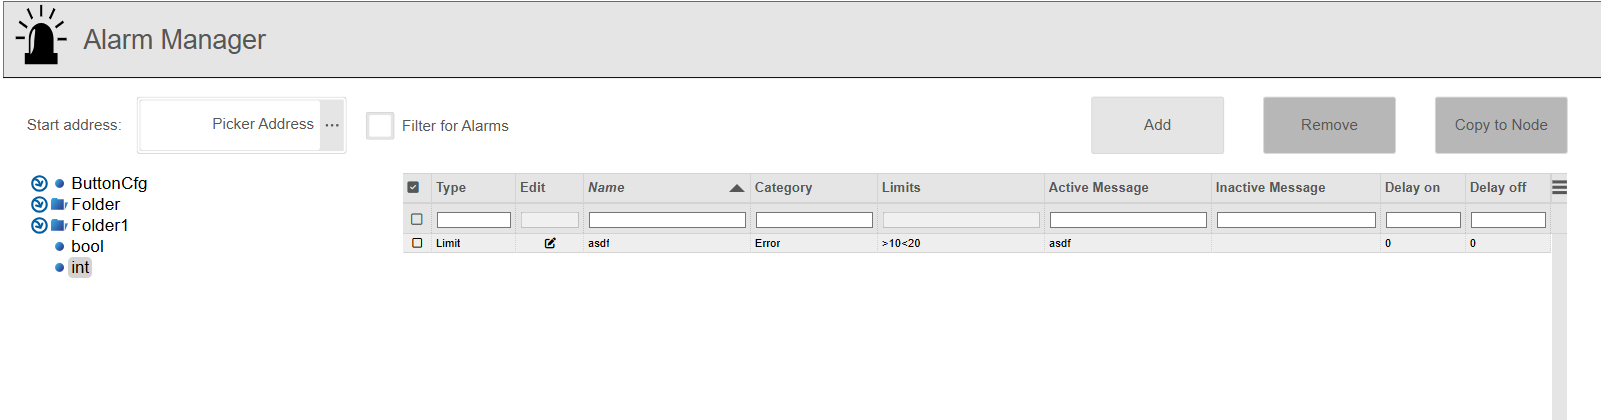
This atvise live component includes an alarm manager, which allows you to create, edit, delete, and copy conditions to other nodes directly within the visualisation.
You can filter based on a specific entry point using the address picker and also the treeview can be filtered to display only nodes and their substructure if an alarm configuration is included.
If you add a new alarm configuration to a node you can choose a configuration name, the condition type and a condition name and after that related to the choosen conditionn type (Disrcete, Retrigger, Limit) a popup will appear withthe same fields for the configuration as in the atvise builder.
When copying alarm conditions to another node, you can select one or more conditions in the table and click the "Copy to node"-button, which will open a node selector where you can choose the desired target node.
Hint:
Please ensure that the user configuring the alarms has read rights for Alarming section in the project tree and engineer rights for the desired nodes.
If the user just have read rights there are no adaptions on alarms possible.
Displays:
MAIN > Alarm Manager
Library:
PROJECT > Object Displays > alarmmanager > alarm_manager
PROJECT > Object Displays > alarmmanager > popup > add_alarm
PROJECT > Object Displays > alarmmanager > popup > delete_alarm
PROJECT > Object Displays > alarmmanager > popup > edit_alarm
PROJECT > Object Displays > alarmmanager > popup > selector
PROJECT > Qick Dynamics > TreeView
PROJECT > Resources > treeView > datasources > opcuaAlarms.js
PROJECT > Script Library > alarmmanager > AlterAlarmCondition
PROJECT > Script Library > alarmmanager > BrowseNodesWithAlarm
PROJECT > Script Library > alarmmanager > CopyAlarmCondition
PROJECT > Script Library > alarmmanager > CreateAlarmCondition
PROJECT > Script Library > alarmmanager > GetCondtionType
PROJECT > Script Library > alarmmanager > HasAlarmConfiguration
PROJECT > webMI Methode Scripts > AlterAlarmCondition
PROJECT > webMI Methode Scripts > BrowseNodesWithAlarm
PROJECT > webMI Methode Scripts > CopyAlarmCondition
PROJECT > webMI Methode Scripts > CreateAlarmCondition
PROJECT > webMI Methode Scripts > DeleteAlarmCondition
PROJECT > webMI Methode Scripts > GetAlarmCategories
PROJECT > webMI Methode Scripts > GetAlarmScripts
PROJECT > webMI Methode Scripts > GetConditions
PROJECT > webMI Methode Scripts > GetConditionType
PROJECT > webMI Methode Scripts > HasAlarmConfiguration
atvise® version:
3.13
Content:
Displays:
Objects:
Library:
atvise® version:
3.13
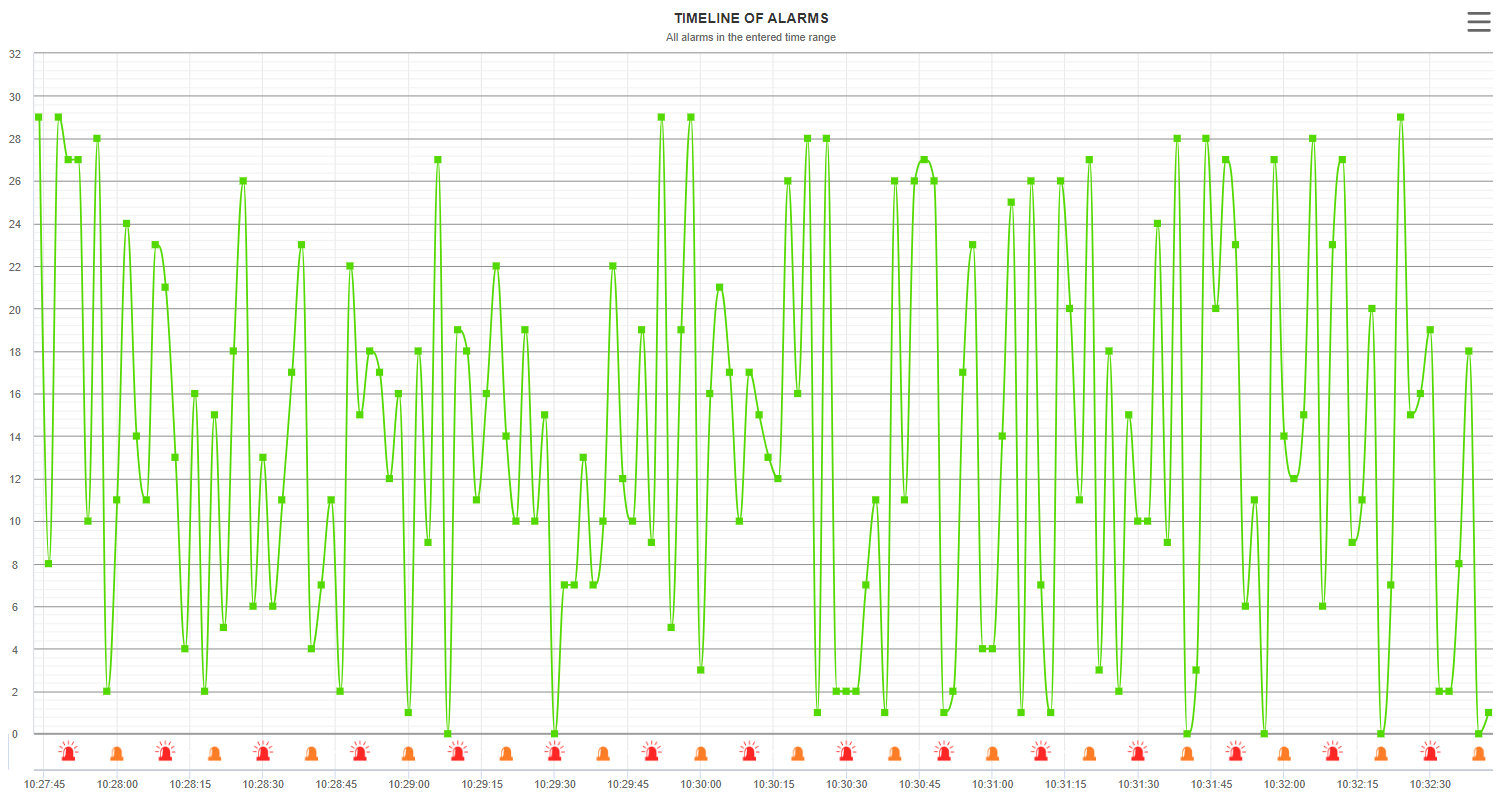
Content:
This atvise live component contains 3 different object display, that can be used to view alarm states and data changes in a chart component. The configuration can be done offline via parameters of the 'highcharts_alarm_container' component or online in the visualization for the other two included object displays. It´s possible to view alarm states and historical raw values for two independent nodes or the alarm states and historical raw values of one node.
Displays:
Objects:
Library:
Historical archive:
atvise® version:
3.13
Content:
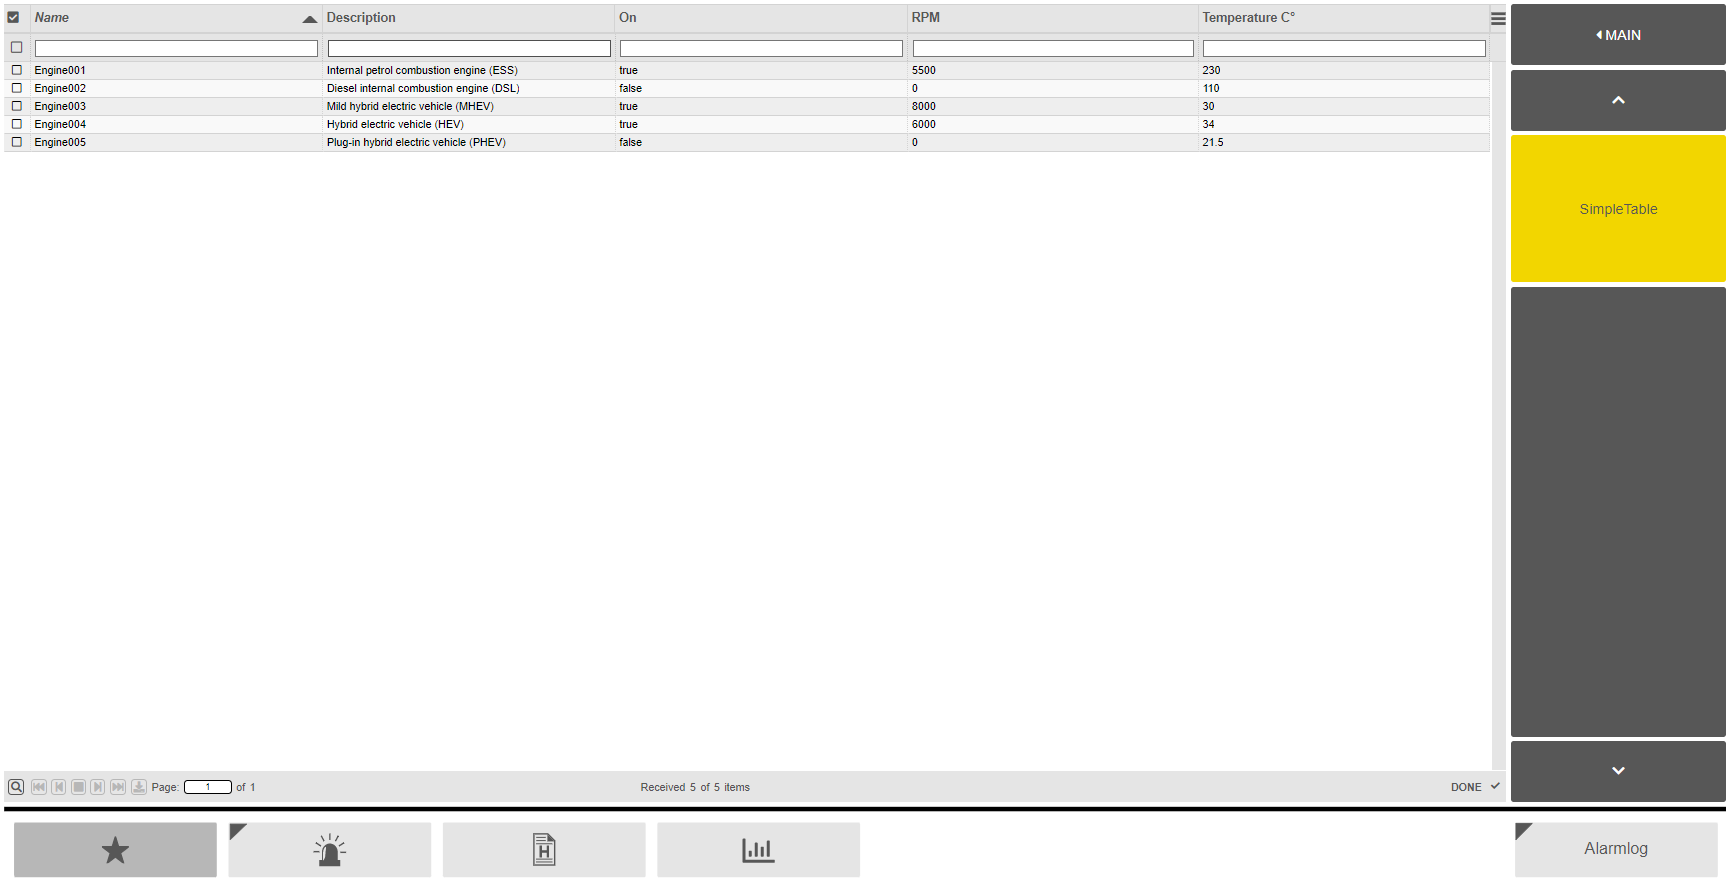
This atvise live component contains a display that can be used as the basis for your own table. This contains the basic handling of the table component and the data handling.
Displays:
MAIN -> SimpleTable
Library:
PROJECT -> Object Displays -> datatable
PROJECT -> Display Scripts -> datatable
PROJECT -> webMI Method Scripts -> GetTableData
atvise® version:
3.13
Content:
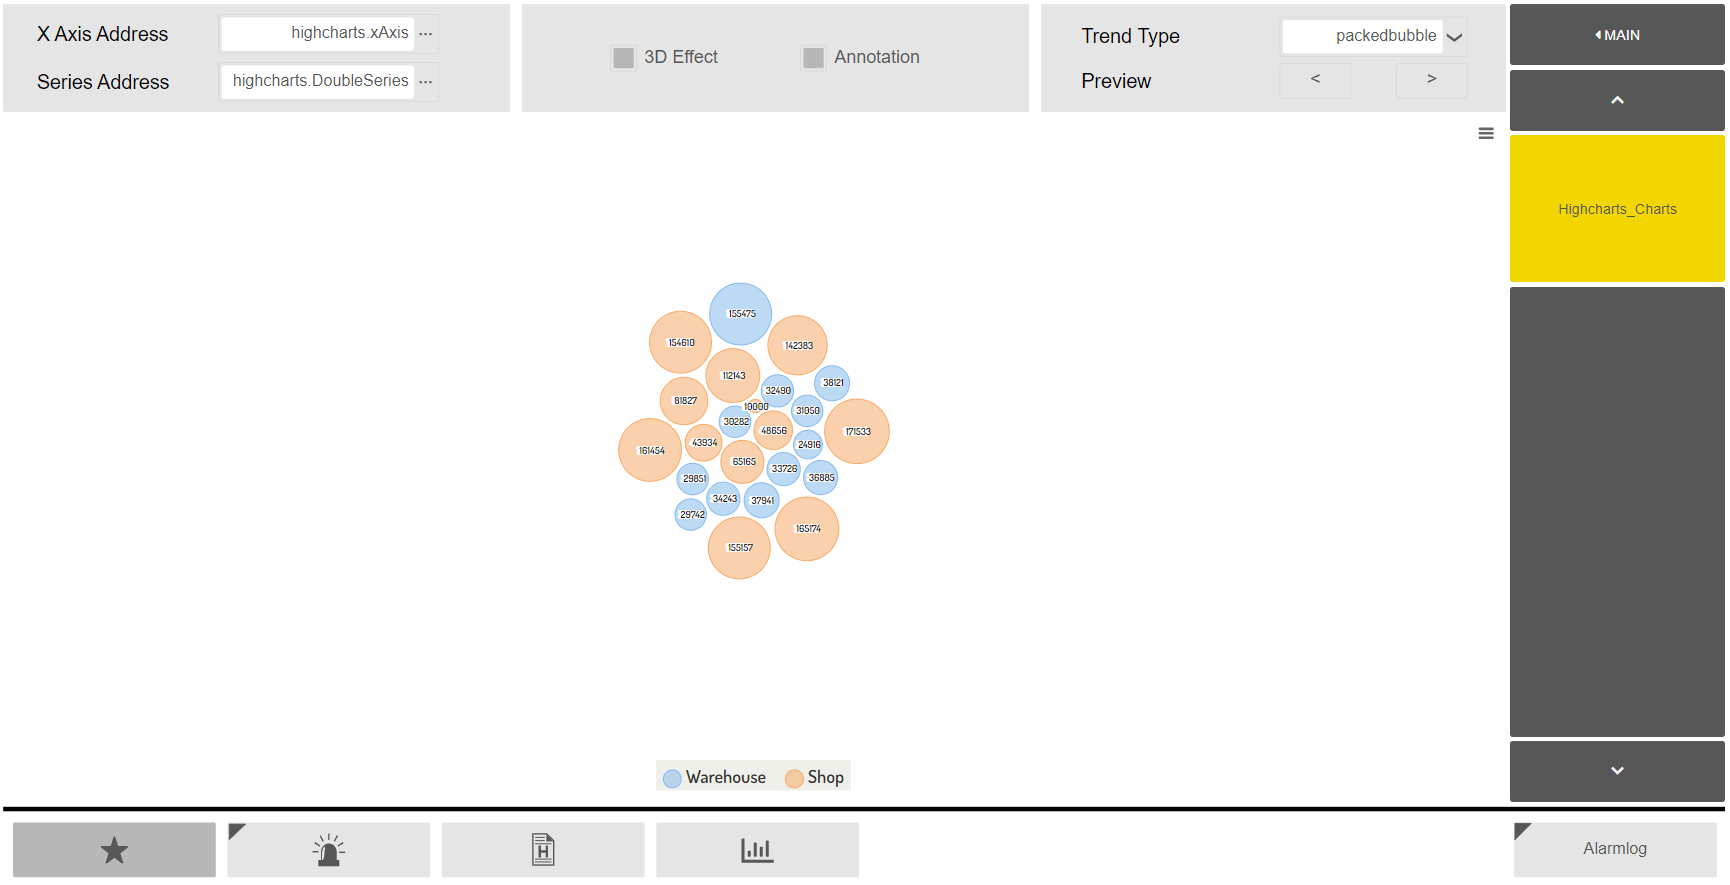
This atvise live component contains a display for showing various types of charts as well as the possibility to activate the 3D option for certain charts. The initial configuration is done via the parameters of the component in the atvise builder and can be changed on-the-fly in the visualisation using the provided components in the display.
Displays:
MAIN -> Highcharts_Charts
Objects:
highcharts -> DoubleSeries
highcharts -> PieceSeries
highcharts -> RangeSeries
highcharts -> SingleSeries
highcharts -> TimeSeries
highcharts -> TreeSeries
highcharts -> xAxis
Library:
PROJECT -> Object Displays -> Advanced -> highcharts -> highcharts_container
PROJECT -> Display Scripts -> highcharts -> highcharts_container
atvise® version:
3.13
Content:
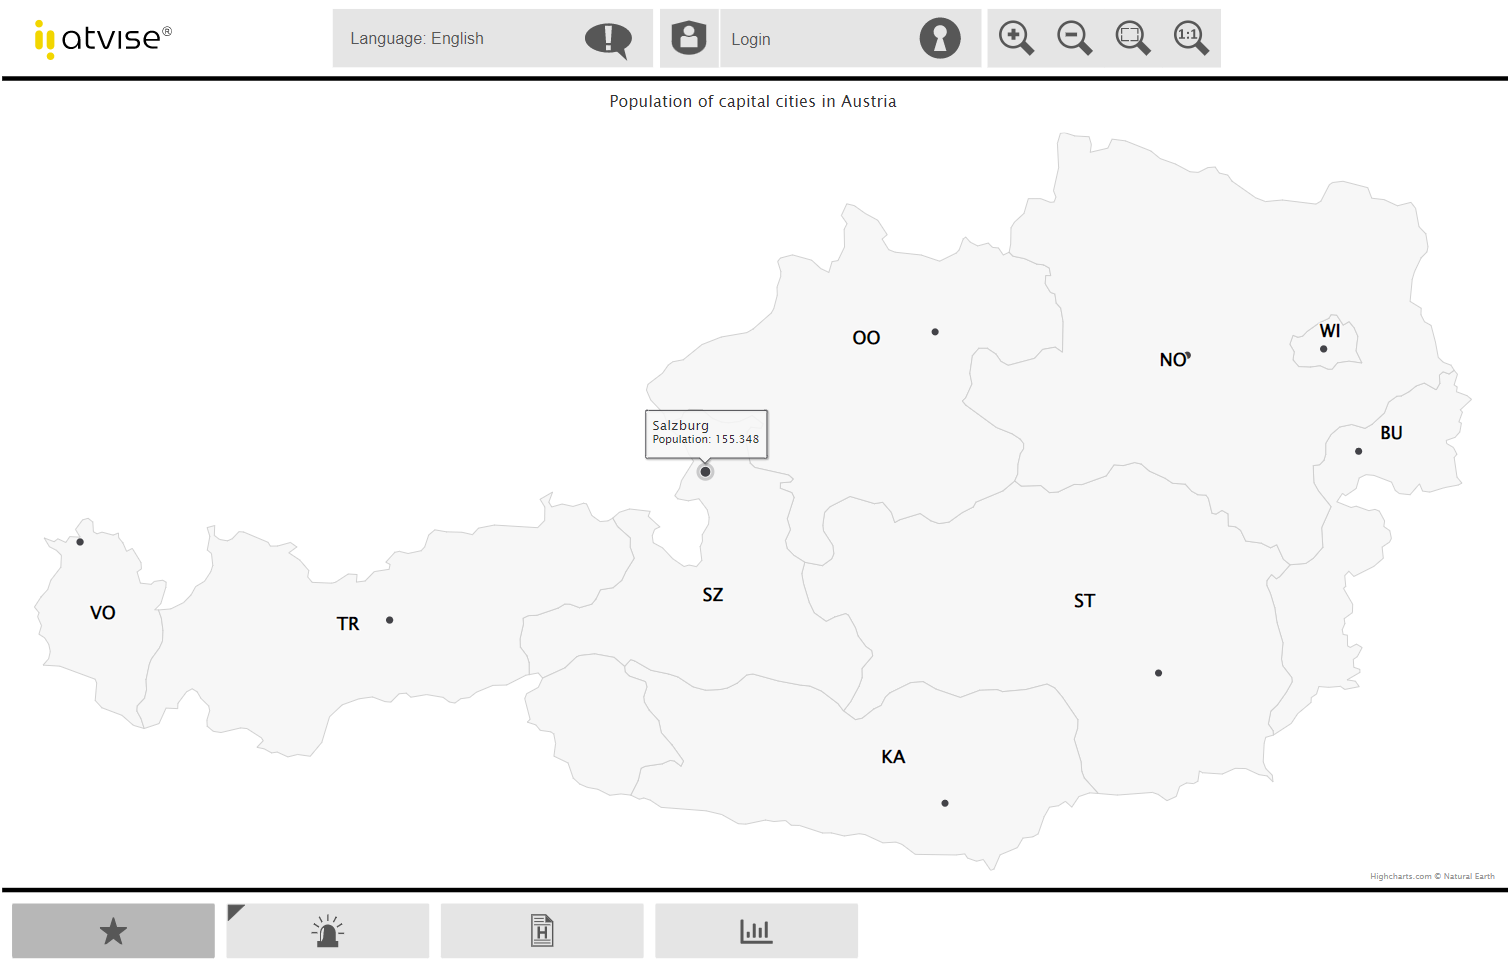
This example shows how the new library "Highmaps", which was included in v3.8, can be used. The display visualizes the cities of Austria including their population.
Displays:
Displays -> MAIN -> Highmaps
Object Displays:
Library -> PROJECT -> Object Displays -> Highmap
Resources:
Library -> PROJECT -> Resources -> highcharts -> atviseModules -> atviseoptimizationsForMaps.js
atvise® version:
3.13
Content:
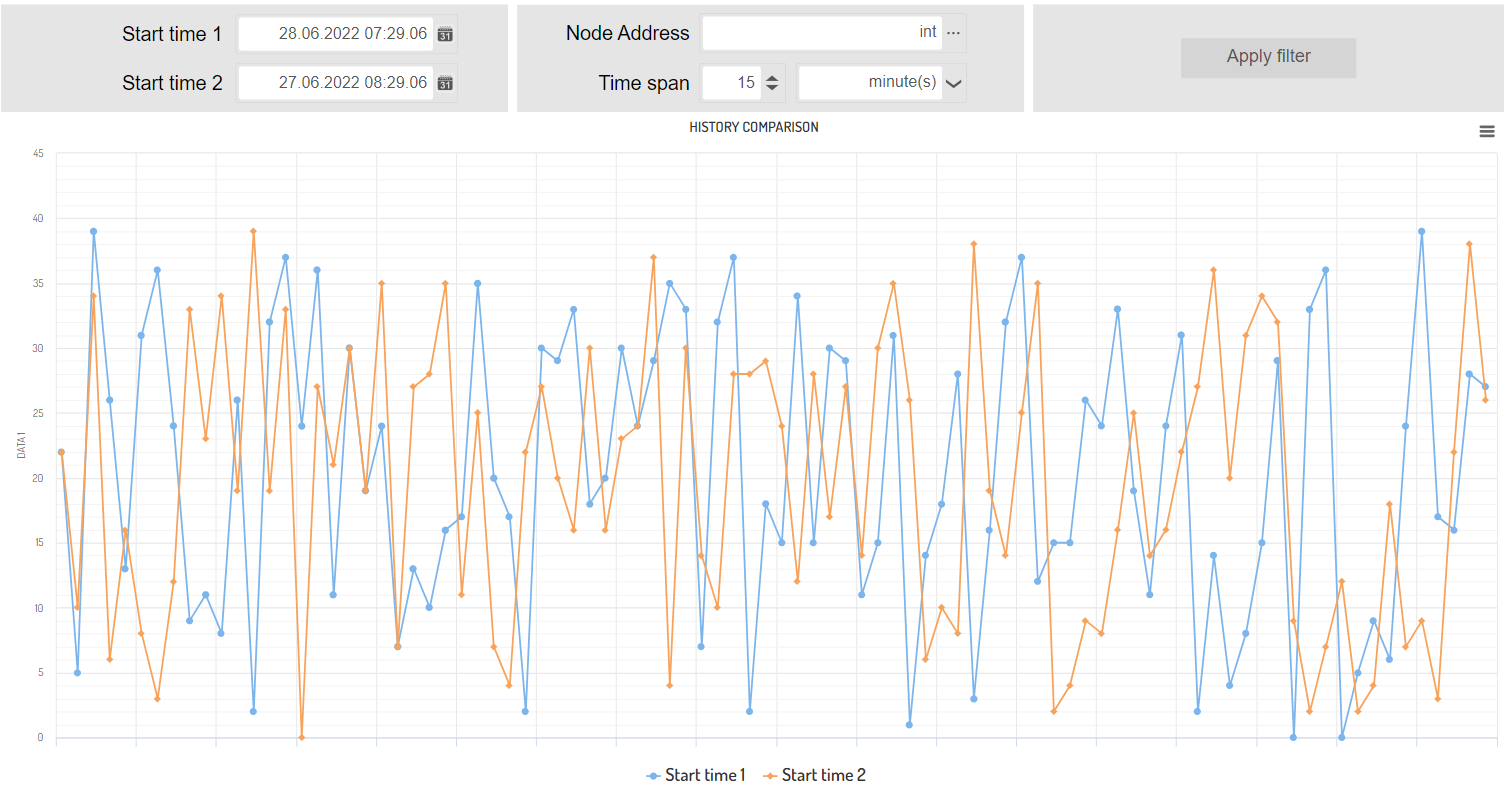
This example provides an object display, which can be used to compare historical data changes for two timespans and one node.
Displays:
Displays -> MAIN -> History Comapre
Object Displays:
Library -> PROJECT -> Object Displays -> history_comparison
Display Scripts:
Library -> PROJECT -> Display Scripts -> history_comparison
atvise® version:
3.13
Content:
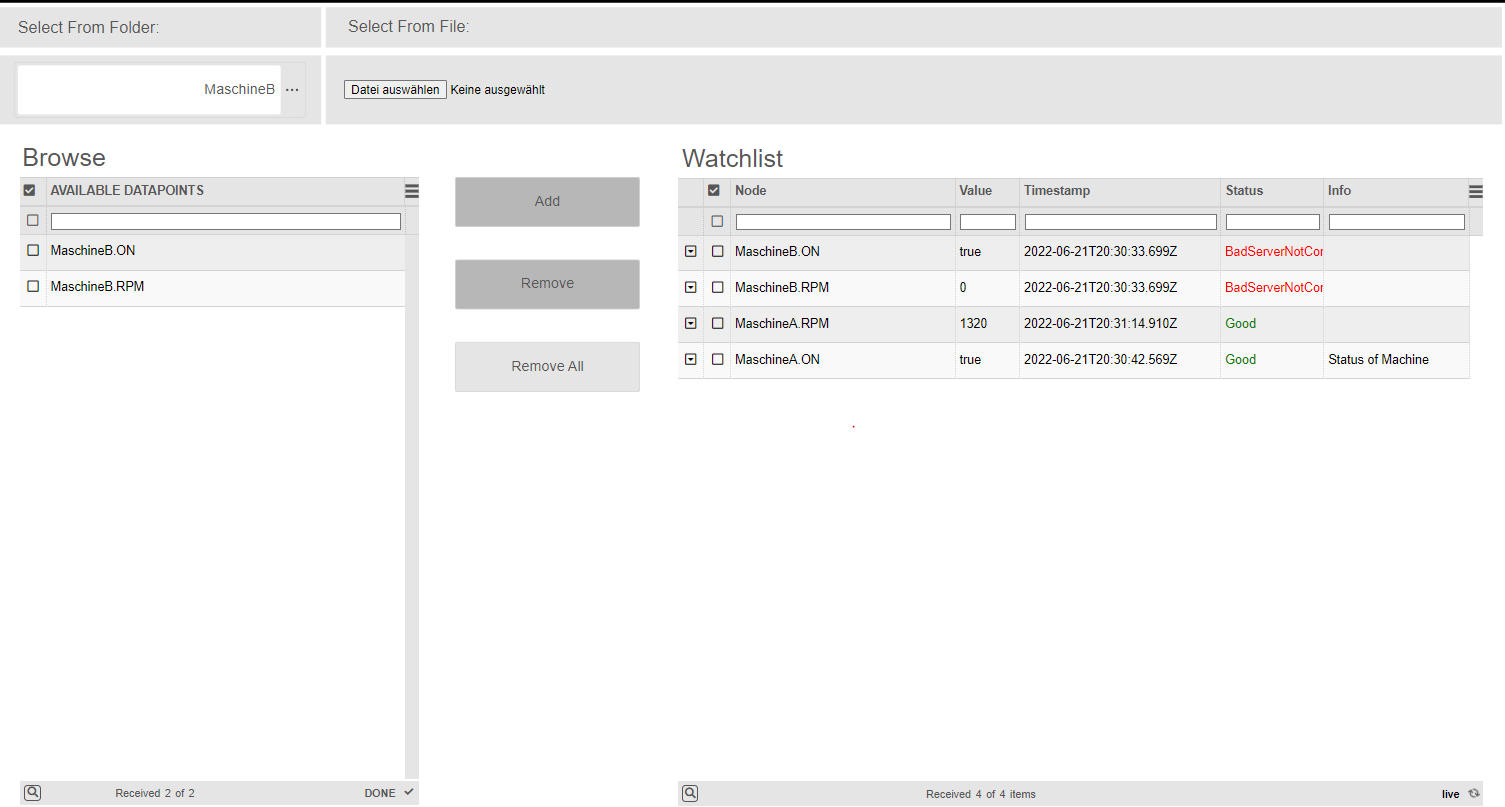
This example provides a configurator for nodes, which should be watched in the visualization. The included table
displays the timestamp information, status and value information and in the detail view you´ll find the address of the
linked node on your data source.
Hint:
Please make sure the user will open the signal table has an engineering right for the parent element of the configured node for parameter "configuration Node".
Example CSV:
AGENT.OBJECTS.bool,
AGENT.OBJECTS.int,
AGENT.OBJECTS.string,
Displays:
Displays -> MAIN -> SignalTable
Objects:
Objects -> OpcUaStandard
Object Displays:
Library -> PROJECT -> Object Displays -> watch_table
Library -> PROJECT -> Object Displays -> watch_table -> dialog_comment
Library -> PROJECT -> Object Displays -> watch_table_config
Display Scripts:
Library -> PROJECT -> Display Scripts -> watch_table
Library -> PROJECT -> Display Scripts -> watch_table -> dialog_comment
Library -> PROJECT -> Display Scripts -> watch_table_config
webMI Method Scripts:
Library -> PROJECT -> CheckConfigNode
Library -> PROJECT -> GetWatchTableNodes
atvise® version:
3.13
Content:
3.13
Content:

Drag and drop the object display (ExportAggregate) into the desired display.
In the visualization you can choose a node, which should be exported. Additional you´ll have to choose a monthly or weekly report and the aggregate you would like to export.
The generated monthly or weekly report would be created in a directory located in your project directory and contains a csv file with all the historical data for your selected node, duration and aggregate.
Hint:
For the example, use "set anonymous and NTLM users as project administrator" under the Access Control menu. This will make the atvise Live example work without setting any defined permission for it.
Object Displays:
Library -> PROJECT -> Object Displays -> ExportAggregate
Library -> PROJECT -> Script Library -> ExportHistory
Library -> PROJECT -> webMI Method Scripts ->ExportHistoryMethod
Library -> PROJECT -> webMI Method Scripts ->GetAggregates
atvise® version:
3.13
Content:

This example shows how to build a Stopwatch timer with start and stop functions and a reset button.
One display example shows the implementation of client-side handling use and the other one includes a stoptimer based on server-side handling. Including used Nodes, and Server script.
Hint:
For the example, use "set anonymous and NTLM users as project administrator" under the Access Control menu. This will make the atvise Live example work without setting any defined permission for it.
Included Displays:
AGENT > DISPLAYS > MAIN > Stopwatch > timer_clientside
AGENT > DISPLAYS > MAIN > Stopwatch > timer_serverside
Object Displays:
SYSTEM.LIBRARY.PROJECT.OBJECTDISPLAYS.timer.timer_clientside
SYSTEM.LIBRARY.PROJECT.OBJECTDISPLAYS.timer.timer_serverside
Included Nodes:
AGENT > OBJECTS > timer > active
AGENT > OBJECTS > timer > hour
AGENT > OBJECTS > timer > min
AGENT > OBJECTS > timer > sec
Server Scripts:
AGENT > OBJECTS > timer > timerHandler
AGENT > OBJECTS > timer > IntervalCyclic
atvise® version:
3.13
Content:
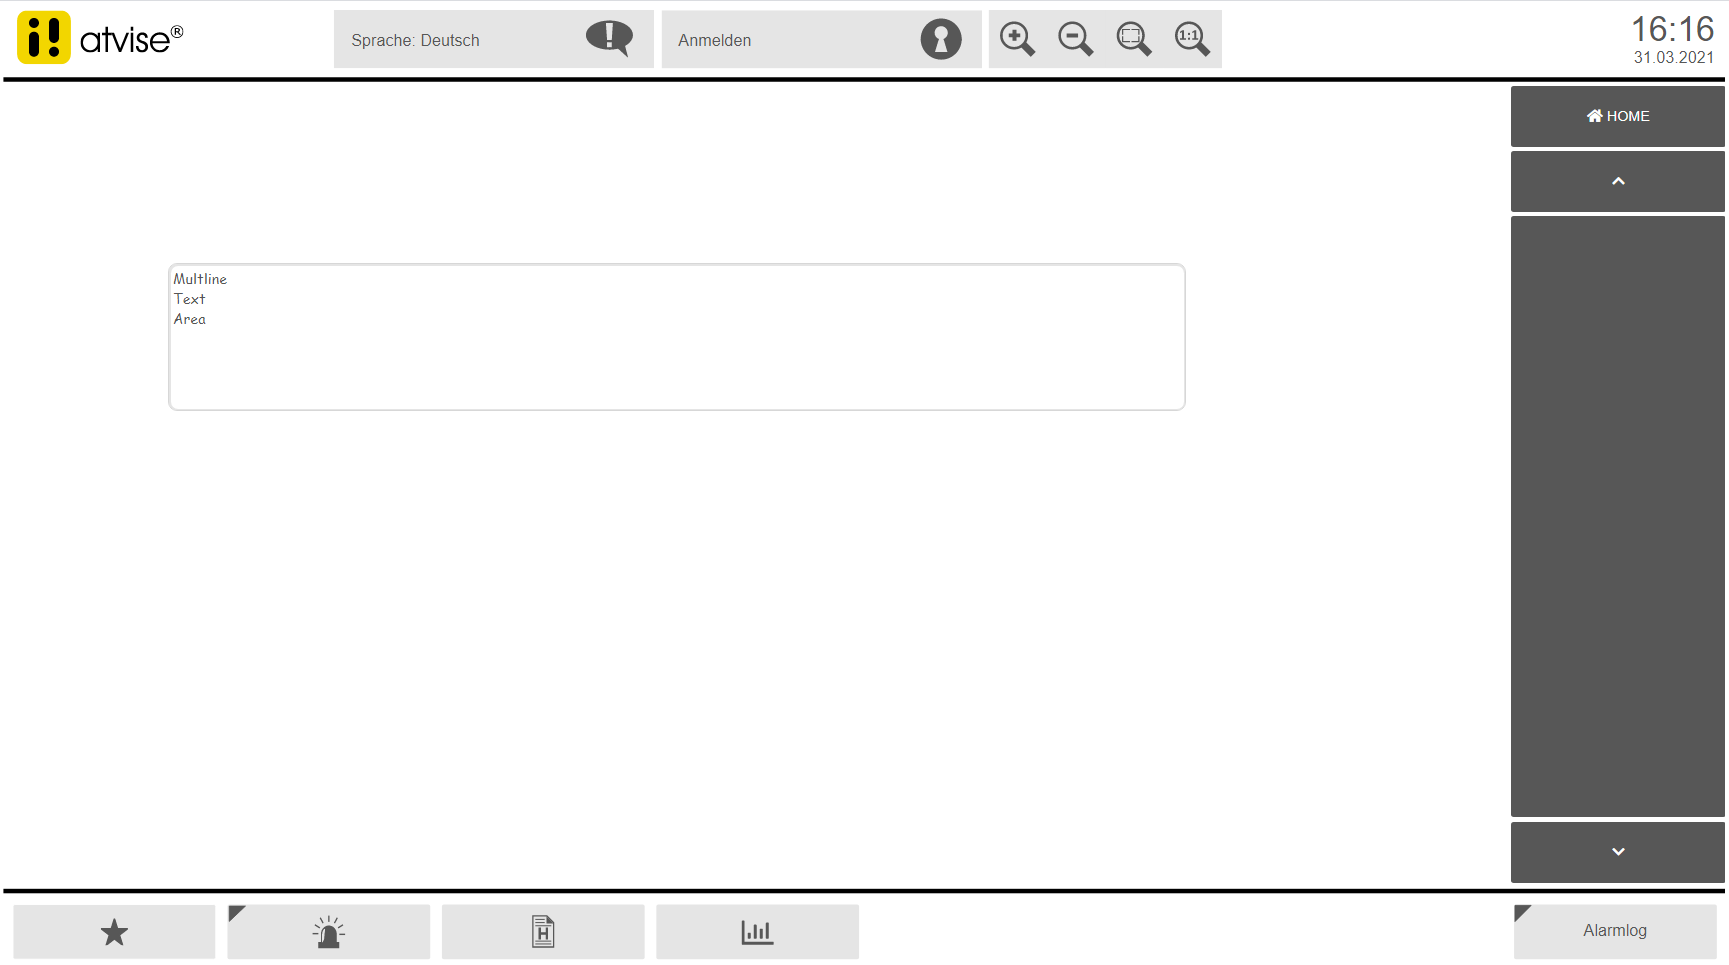
This Element uses a HTML text area to feature a text field that allows the input of multiple lines of text.
It features similar functionality like the atvise in_out_value element, offering the ability to subscribe to a node, in addition to providing the ability to in/output text over multiple lines.
For simplicity reasons the elements can be sized in the ativse builder.
There is also a trigger called "valueChanged" that can be used to connect to value changes done to the element's text. To create a new line of text you need to use shift+enter.
Hint:
For the example, use "set anonymous and NTLM users as project administrator" under the Access Control menu. This will make the atvise Live example work without setting any defined permission for it.
Included Displays:
SYSTEM > LIBRARY > PROJECT > OBJECTDISPLAYS > Advanced > TextArea
atvise® version:
3.13
Content:
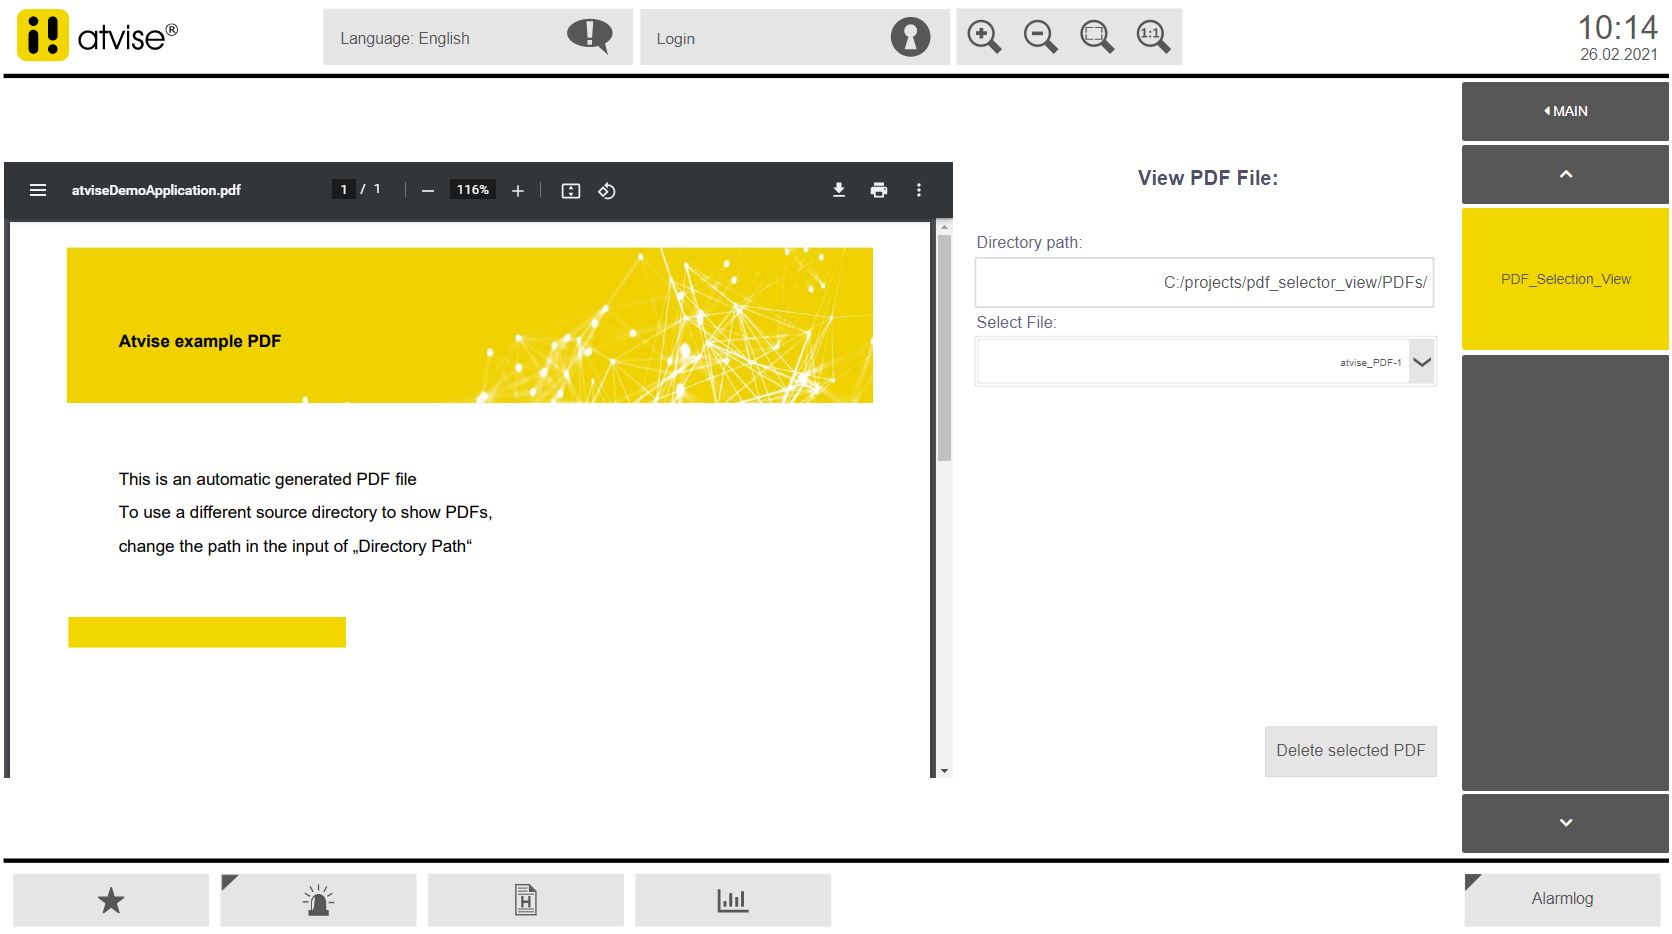
This example shows how to build a PDF Viewer display that shows PDF files selected through a combo box list in a hmi iframe. The PDF files are read from the filesystem from the given system directory and placed for selection into the combo box.
The selected PDF File can also be deleted from the filesystem by an implemented button.
Also included is a modified in_out_value component which gives the option of setting a maximum input-texlength for typing in text with SVGKeyboard and also gives warning message inside of the keyboard component if the limit is reached. Further also a input mode (replacing Text on typing in OR adding the characters in the end) is included.
Hint:
For the example, use "set anonymous and NTLM users as project administrator" under the Access Control menu. This will make the atvise Live example work without setting any defined permission for it.
Included Displays:
AGENT > DISPLAYS > MAIN > PDF_Selection_View
Object Displays:
SYSTEM > LIBRARY > PROJECT > OBJECTDISPLAYS > Advanced > keyboard > keyboard
SYSTEM > LIBRARY > PROJECT > OBJECTDISPLAYS > Advanced > keyboard > number_keyboard
SYSTEM > LIBRARY > PROJECT > OBJECTDISPLAYS > Advanced > in_out_value
SYSTEM > LIBRARY > PROJECT > OBJECTDISPLAYS > PDF_Reader > LoadPDF
SYSTEM > LIBRARY > PROJECT > OBJECTDISPLAYS > Popups > popup_deletePDF
Display Scripts:
SYSTEM > LIBRARY > PROJECT > DISPLAYSCRIPTS > keyboard > keyboard
SYSTEM > LIBRARY > PROJECT > DISPLAYSCRIPTS > keyboard > number_keyboard
SYSTEM > LIBRARY > PROJECT > DISPLAYSCRIPTS > in_out_value
Included Nodes:
AGENT > OBJECTS > PDF_View > Directory_Path
AGENT > OBJECTS > PDF_View > FileName
Resources:
SYSTEM > LIBRARY > PROJECT > RESOURCES > atviseDemoApplication.pdf (empty PDF which will be filled and replaced on every selection)
webMI Method Scripts (Server Scripts):
SYSTEM > LIBRARY > PROJECT > webMI Method Scripts > GET_FILES_FROM_DIRECTORY
SYSTEM > LIBRARY > PROJECT > webMI Method Scripts > REPLACE_PDF
SYSTEM > LIBRARY > PROJECT > webMI Method Scripts > DELETE_PDF
SYSTEM > LIBRARY > PROJECT > webMI Method Scripts > START (Just needed for initial creation of PDFs and for testing issues!)
atvise® version:
3.13
Content:
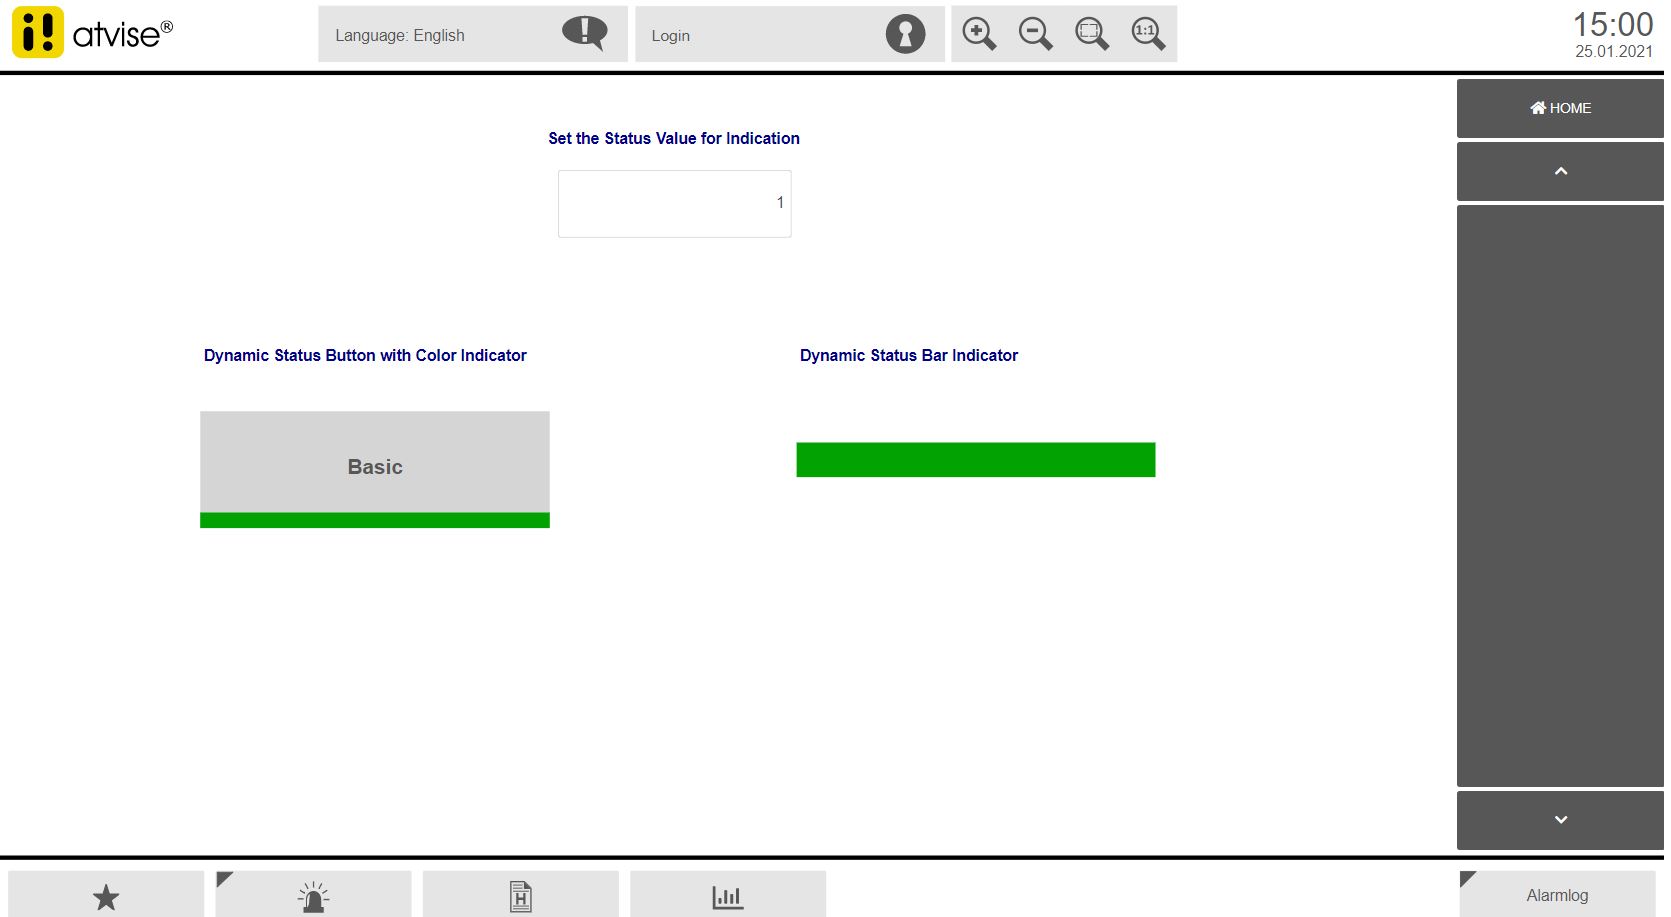
This example shows a modified Button Component which uses a status variable and color indication configuration to display the actual status of an interger node. The colors for each status can be defined as color parameters. The same can be done for a simple rectangle element what uses similar status color configurations.
The Button includes also usage of a node structure with 4 different variables. For status, activation, click – status, press and release – status.
Hint:
For the example, use "set anonymous and NTLM users as project administrator" under the Access Control menu. This will make the atvise Live example work without setting any defined permission for it.
Included Displays:
AGENT > DISPLAYS > MAIN > Dynamic_Status_Indication
Included Object Displays:
SYSTEM > LIBRARY > PROJECT > OBJECTDISPLAYS > Advanced > button_dynamic_status SYSTEM > LIBRARY > PROJECT > OBJECTDISPLAYS > Advanced > bar_dynamic_status
Included Nodes:
AGENT > OBJECTS > button_dyn_status_structure > Active, Click, Press, Status AGENT > OBJECTS > Module_active
Global Parameters:
SYSTEM > GLOBALS > StatusColors > Status0 … 10
atvise version:
3.13
Content:
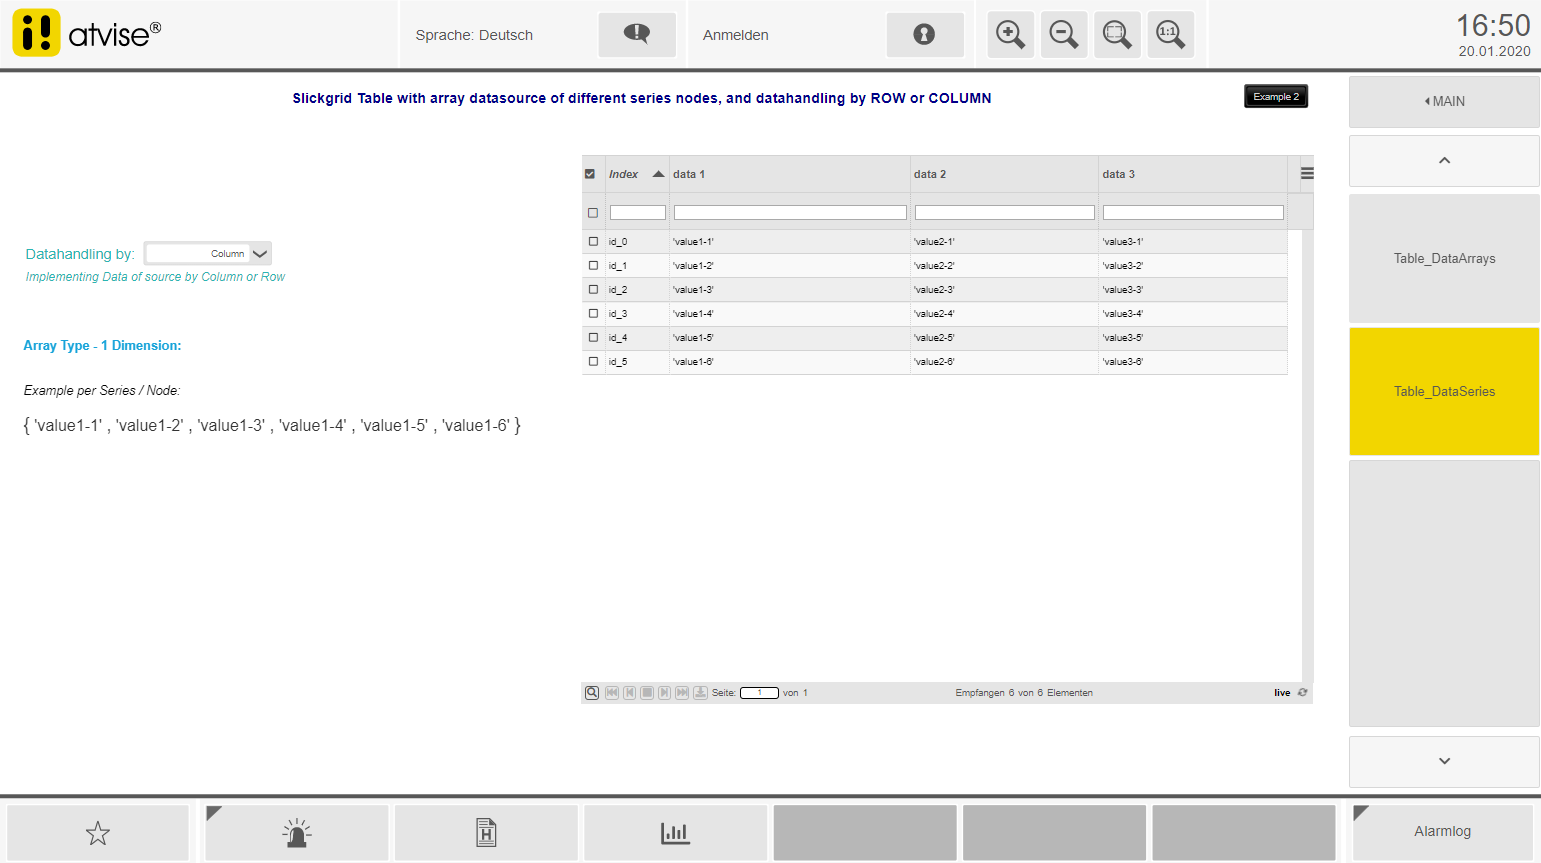
This example of the slickgrid table shows how to add data into the table by an array data source of one or two-dimensional array structures. Also a data handling by filling the table with data per row or column is included. In the example JSON object arrays are used. The display script includes individual data handling for 3 example types of array structures. The „live“ update functionality is used to update the table data by data source value changes or parameter value changes.
Hint:
For the example, use "set anonymous and NTLM users as project administrator" under the Access Control menu. This will make the atvise Live example work without setting any defined permission for it.
Included Displays:
AGENT > DISPLAYS > Main > Table_DataSeries
AGENT > DISPLAYS > Main > Table_DataArrays
Object Displays:
SYSTEM > LIBRARY > PROJECT > OBJECTDISPLAYS > Advanced > slickgrid > table
SYSTEM > LIBRARY > PROJECT > OBJECTDISPLAYS > Advanced > slickgrid > table_dataseries
SYSTEM > LIBRARY > PROJECT > OBJECTDISPLAYS > Advanced > slickgrid > table_dataarrays
Included Nodes:
AGENT > OBJECTS > ArrayModeInt
AGENT > OBJECTS > dataArrayType
AGENT > OBJECTS > TableArr_md_1
AGENT > OBJECTS > TableArr_md_2
AGENT > OBJECTS > TableArr_md_3
AGENT > OBJECTS > TableArrColmn1
AGENT > OBJECTS > TableArrColmn2
AGENT > OBJECTS > TableArrColmn3
Global Parameters:
SYSTEM > GLOBALS > atvObjectDisplays > Tables > ColorConfig1
Optimized table color configuration for this examples
atvise® version:
3.13
Content:
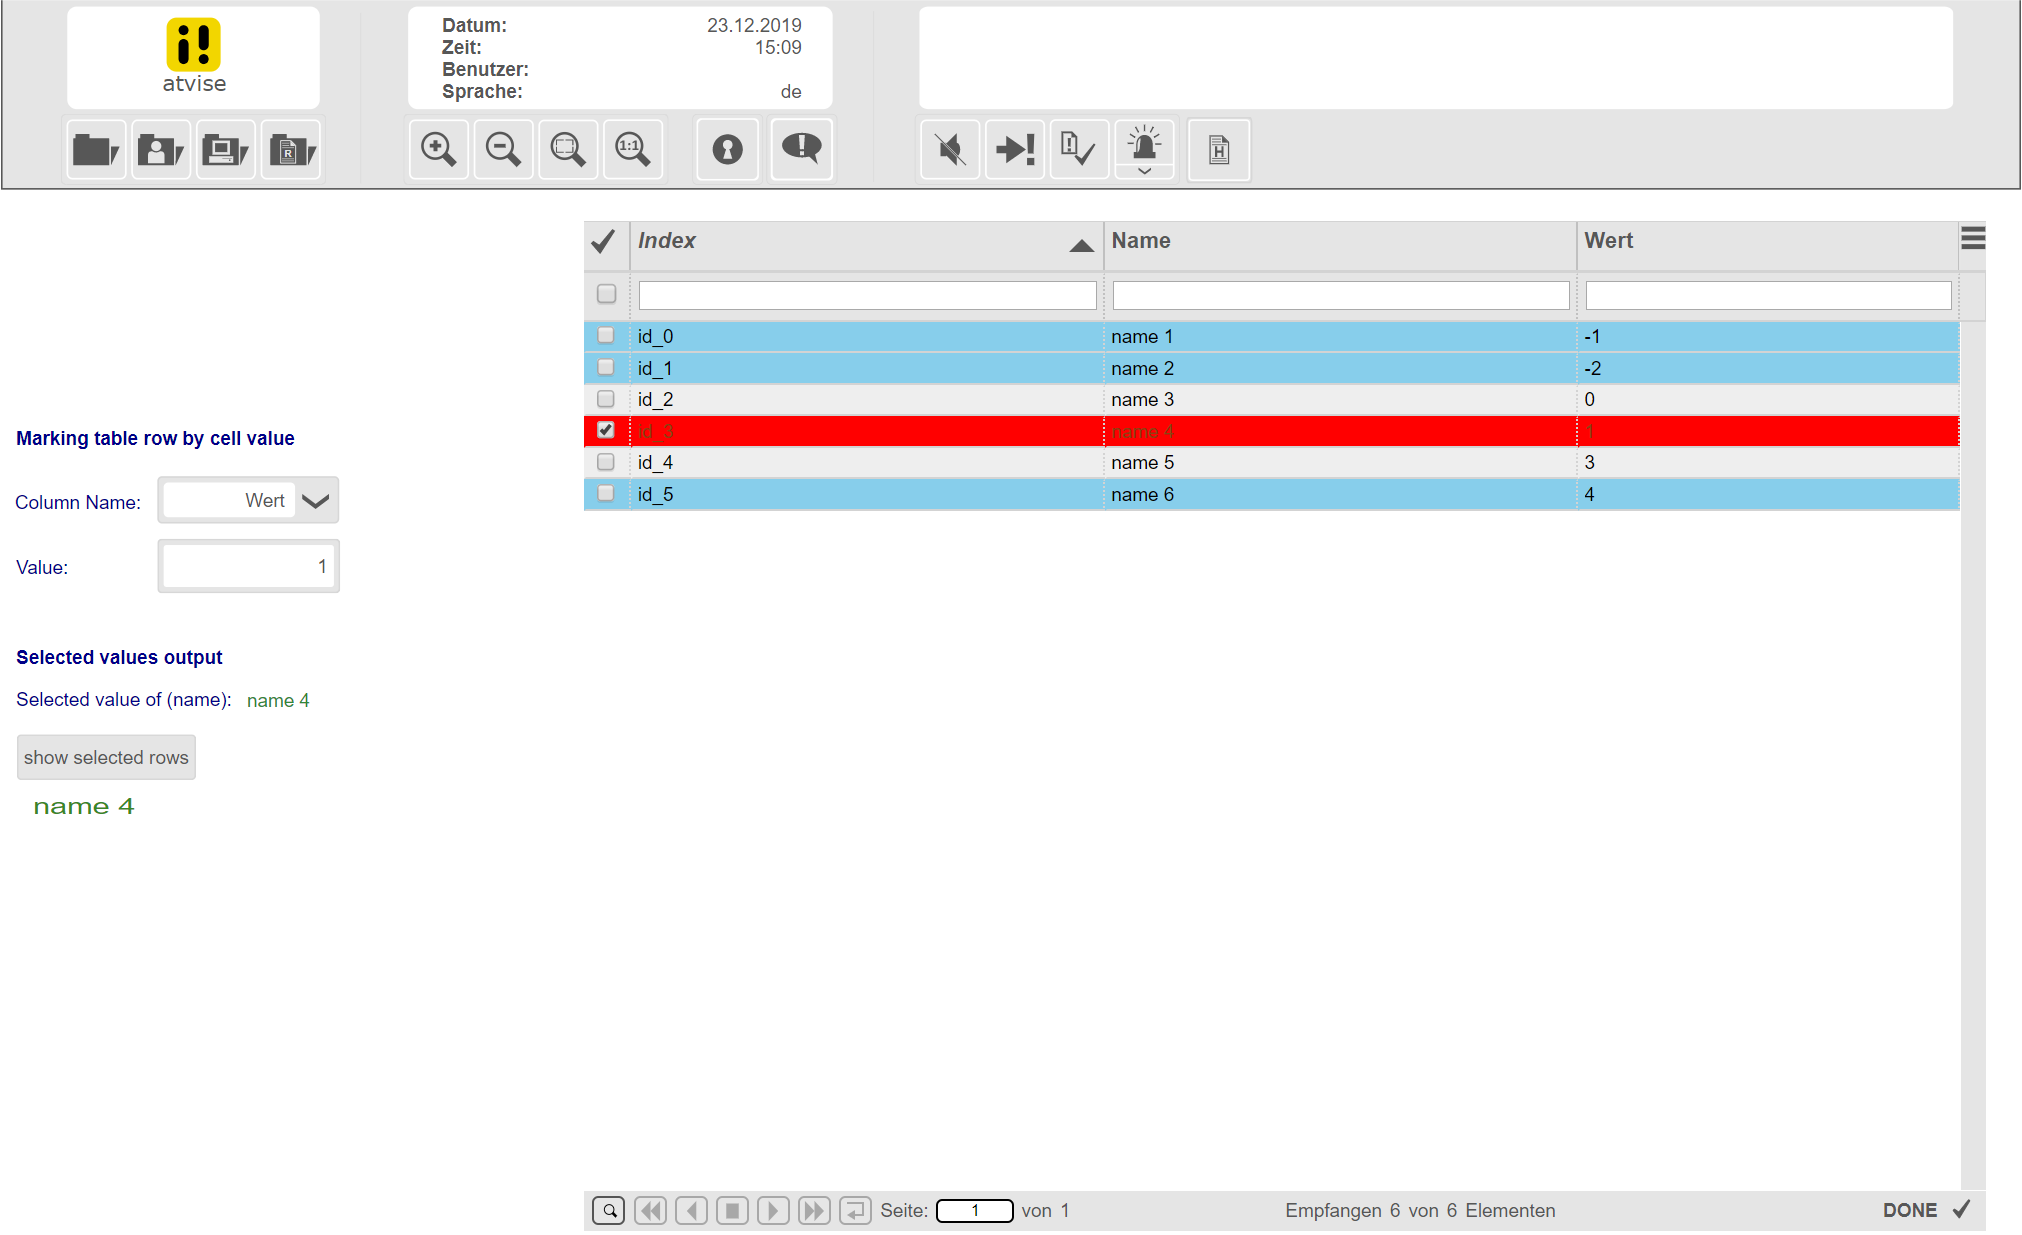
This example shows how to select and mark a table row by clicking on the row data itself, by searching the row with a specific value and includes an output possibility of the active row data.
Hint:
For the example, use "set anonymous and NTLM users as project administrator" under the Access Control menu. This will make the atvise Live example work without setting any defined permission for it.
Included Nodes:
AGENT > OBJECTS > nameSelect
AGENT > OBJECTS > valueSelect
Included Displays:
AGENT > DISPLAYS > MAIN > SlickGrid Table
Global Parameters:
SYSTEM > GLOBALS > atvObjectDisplays > Tables > ColorConfig1
atvise® version:
3.13
Content:
Quickdynamic to change the appearance of the mouse pointer to e.g. clarify clickable objects
Target system:
webMI + SCADA
Hint:
For the example, use "set anonymous and NTLM users as project administrator" under the Access Control menu. This will make the atvise Live example work without setting any defined permission for it.
Included Nodes:
Library -> Quickdynamic -> change_mouse_cursor
atvise® version:
3.13
Content:
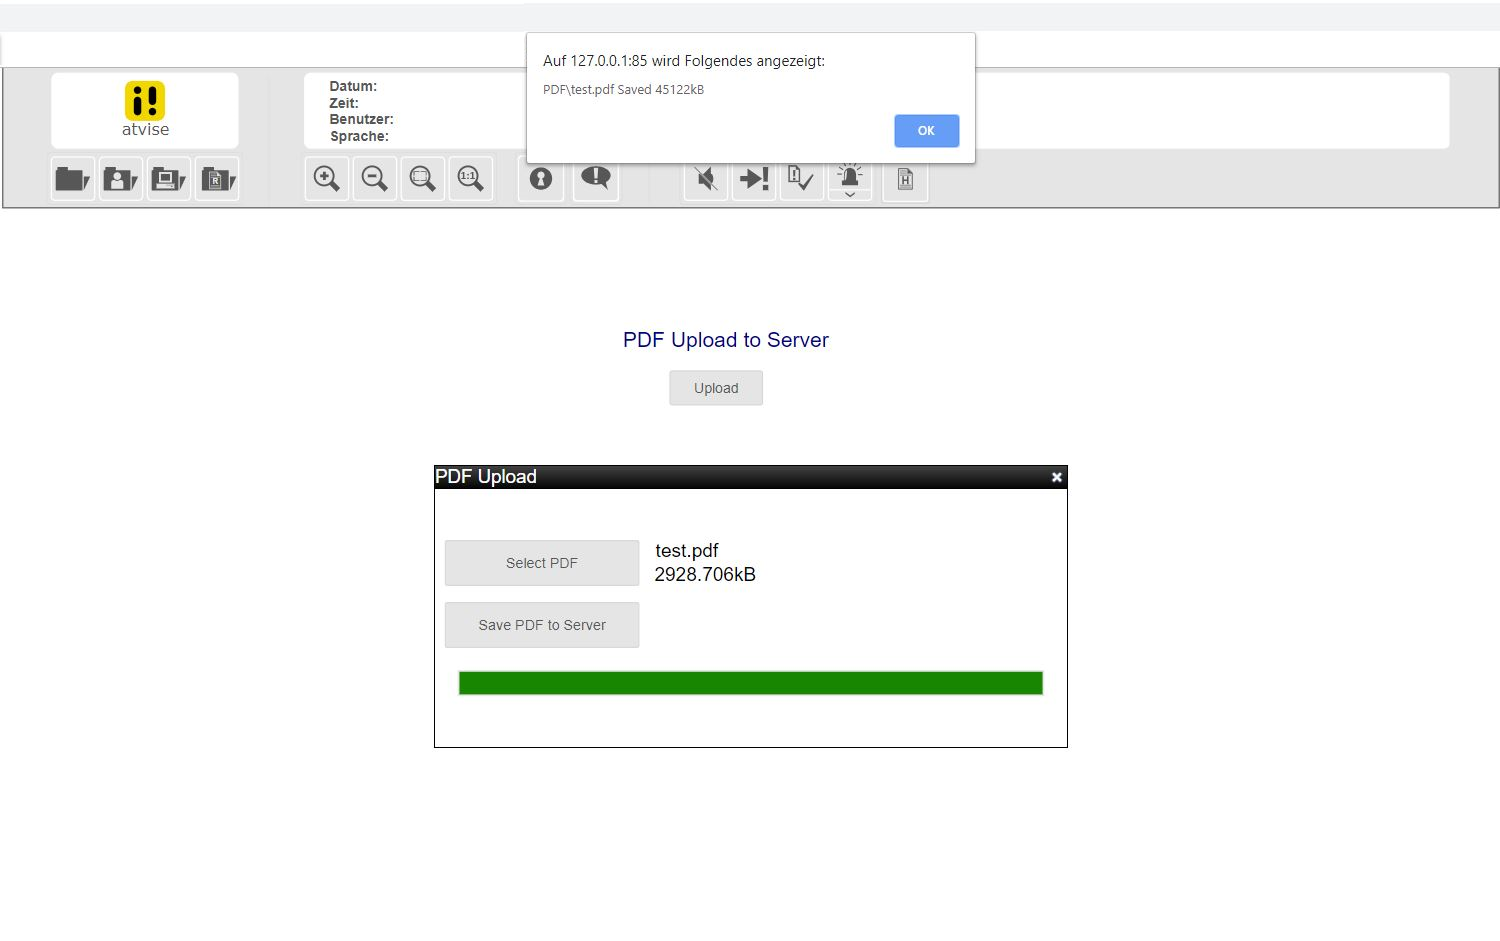
This example upload a PDF-file in samples to the server. The file will be found in the subdirectory „PDF“ of the project-directory.
Hint:
For the example, use "set anonymous and NTLM users as project administrator" under the Access Control menu. This will make the atvise Live example work without setting any defined permission for it.
Included Nodes:
AGENT > DISPLAYS > MAIN > Upload
Library > PROJECT > Object Displays > UPLOAD > Popup
Library > PROJECT > Ressources > scripts > uploadfile
atvise® version:
3.13
Content:
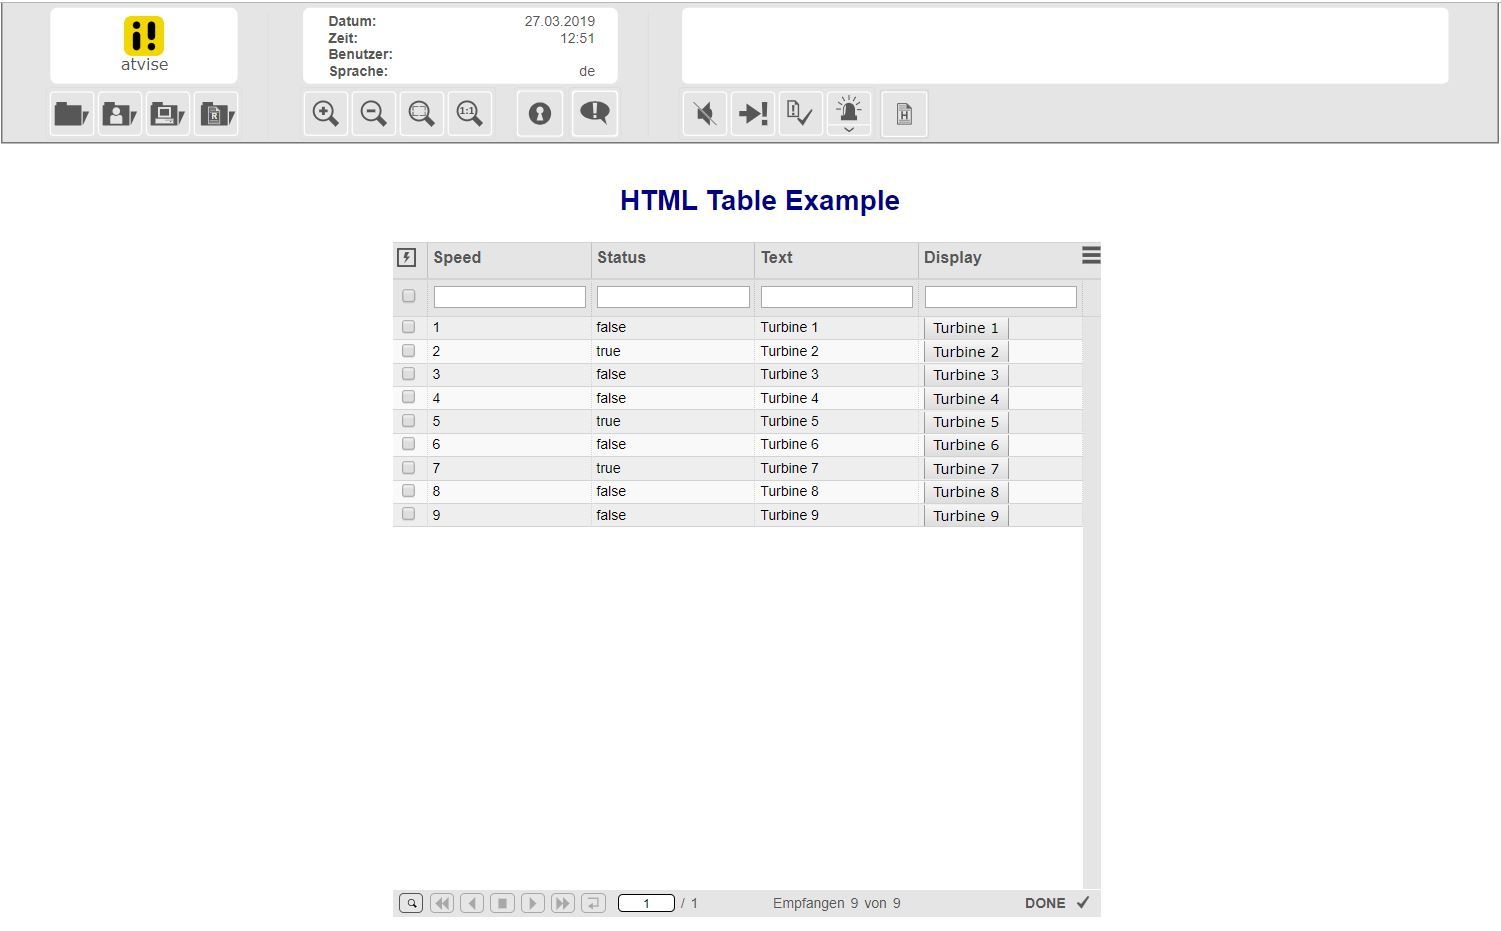
This example display shows the usage of the new atvise HTML Table
Target system:
webMI + SCADA
Hint:
For the example, use "set anonymous and NTLM users as project administrator" under the Access Control menu. This will make the atvise Live example work without setting any defined permission for it.
Included Nodes:
AGENT > DISPLAYS > MAIN > HTML
Library > PROJECT > Object Displays
OBJECTTYPES > PROJECT > Turbine > *
atvise® version:
3.13
Content:
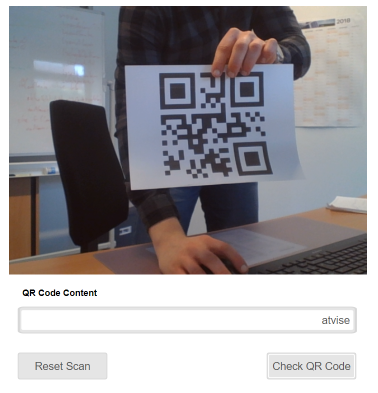
QR code scan example that supports live scan and a file upload fallback if
live scan is not available (user media not accessible)
Hint:
For the example, use "set anonymous and NTLM users as project administrator" under the Access Control menu. This will make the atvise Live example work without setting any defined permission for it.
Imported Resources:
SYSTEM.LIBRARY.PROJECT.RESOURCES/QRCodeScanner/*
AGENT.DISPLAYS.MAIN.QR_Code_Scan
SYSTEM.LIBRARY.PROJECT.OBJECTDISPLAYS.qr_code_scan
atvise® version:
3.13
Content:

This example will show you how to add a shadow to an element using a QuickDynamic.
Hint:
For the example, use "set anonymous and NTLM users as project administrator" under the Access Control menu. This will make the atvise Live example work without setting any defined permission for it.
The following quick dynamics will be created:
Library > Project > QuickDynamics > Filter_Shadow
atvise® version:
3.13
Content:
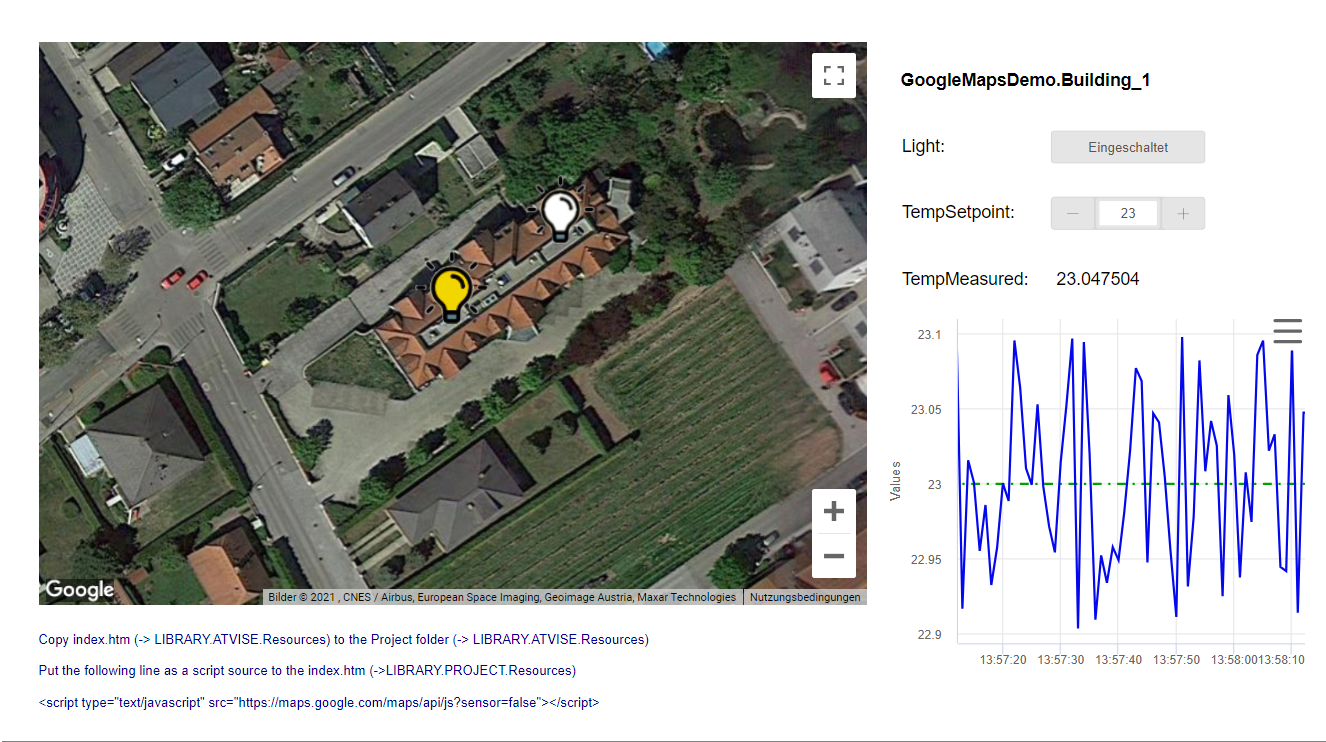
This example shows the integration of a Google Maps element into the atvise visualization. Furthermore, it shows the usage of the Google Maps API in the script - including functions like changing the symbol of markers based on data values, showing data values in info windows and opening a detail display when clicking on a marker. It also includes an object type and two instances of it to provide some simulated data values. In order to remove the message box when loading the page please generate your own Google API key.
Hint:
For the example, use 'set anonymous and NTLM users as project administrator' under the Access Control menu. This will make the atvise Live example work without setting any defined permission for it.
Included Displays:
AGENT > DISPLAYS > MAIN > GoogleMapsDemo
Included Object Types:
Object Types > Building
Included Nodes:
AGENT > OBJECTS > GoogleMapsDemo > Building_1 AGENT > OBJECTS > GoogleMapsDemo > Building_2
Resources:
Library > PROJECT > Resources > lamp_off.png Library > PROJECT > Resources > lamp_on.png
atvise version:
3.13
Content:
An ObjectType that opens a pop-up with integrated tabs.
Target system:
webMI + SCADA
Create one or more object instances from this ObjectType at Servers > My Server > OBJECTS. Then drag-and-drop the instance(s) to an opened display. After saving the changes to the display, you can load it in your visualization.
Hint:
For the example, use "set anonymous and NTLM users as project administrator" under the Access Control menu. This will make the atvise Live example work without setting any defined permission for it.
Included Nodes:
Name: PopUp_Tabs
Type: ObjectType
Path: Object Types
atvise® version:
3.13
Content:

This example displays an animated rotor.
Target system:
webMI + SCADA
Drag & drop the rotor display into your display.
Set the address to a bool node to start/stop the rotation (false for no rotation). Then use Parameters to set the rotation speed.
Hint:
For the example, use "set anonymous and NTLM users as project administrator" under the Access Control menu. This will make the atvise Live example work without setting any defined permission for it.
Included Nodes:
Name: rotor
Type: Display
Path: Library > PROJECT > Object Displays
atvise® version:
3.13